
by Emily Hostetler, Sara Benson, and Roxanne Lee
It’s not just in your head; Boston really is hotter in the summer. When urban areas are warmer than surrounding non-urban environments, we experience a phenomenon called the urban heat island (UHI) effect.
Cities are filled with large amounts of artificial materials, such as concrete and asphalt, that absorb heat throughout the day and release heat at night. Living materials like trees, flowers, and grass tend to make areas feel cooler due to the shade they create and the water they release from their leaves, thus counteracting the UHI effect. Take a walk through the park or near the water on a hot summer day and you might just experience this for yourself!
Tracking temperatures as cities heat up
As daily average temperatures increase across the globe, scientists have been tracking surface temperature data using satellite imaging that records the temperature of roads, sidewalks, and other ground-level materials. While this helps us have a general idea of how hot certain areas are, surface temperatures tend to be much hotter than what we actually feel when we are outside.
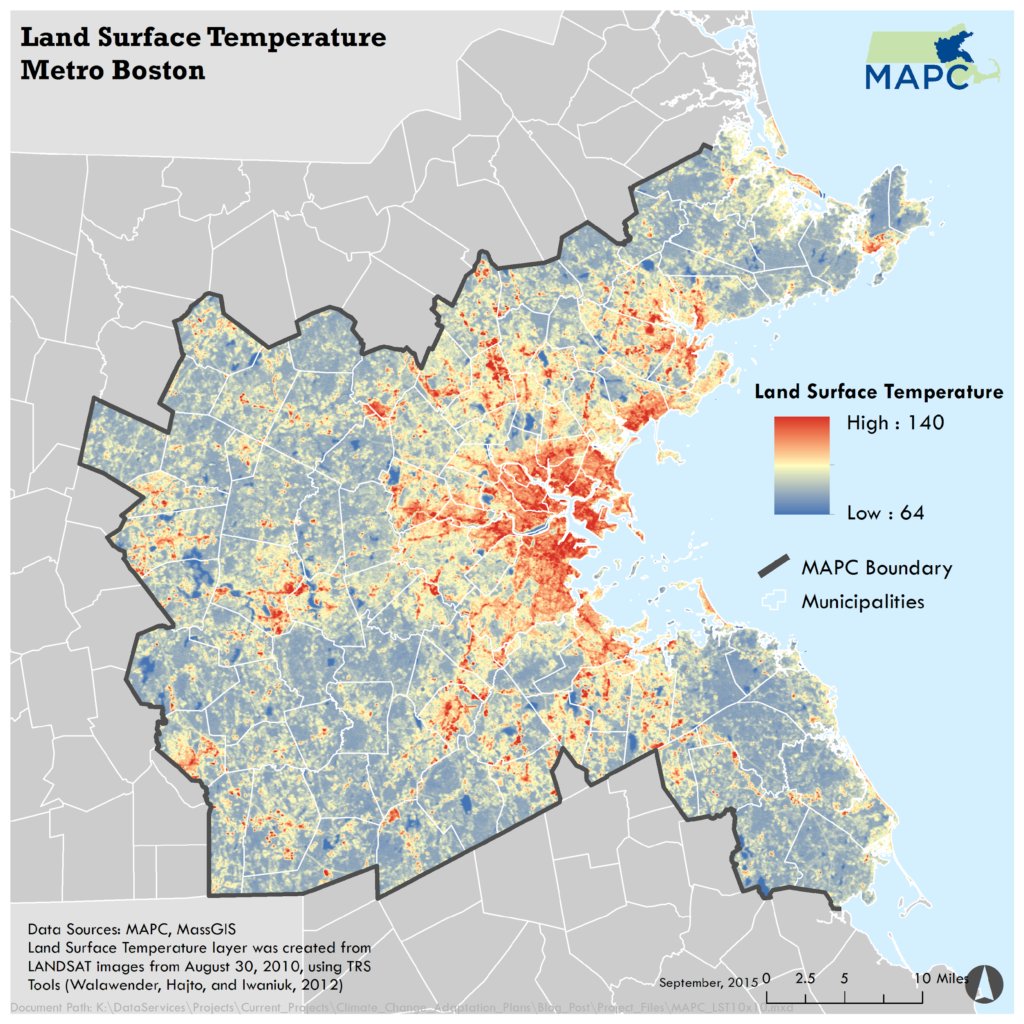
In order to help cities cope with extreme heat, scientists need to capture the ambient air temperature, which is the temperature of the air that surrounds us. By measuring the temperature of the air we breathe and feel, city planners can more accurately assess the potential health impacts of extreme heat.
Can we combat the UHI effect?
John Bolduc, Environmental Planner for the City of Cambridge, said this new data will be valuable because it will provide high resolution temperature and humidity data, along with better night time temperature data. “We understand that the city cannot directly affect the rising temperatures, but we also know we have an urban heat island problem that we can do something about,” Bolduc said.
Alisha Pegan, Climate Ready Boston Coordinator, said many different agencies, including the Boston Public Health Commission, will be able to use this data to “expand research on public health, green infrastructure, tree canopy, and more.”
“The heat maps will show the air temperature in Boston, which will tell us how people are experiencing the urban environment — not just buildings or roads,” she said.
Collecting urban heat island data with citizen science
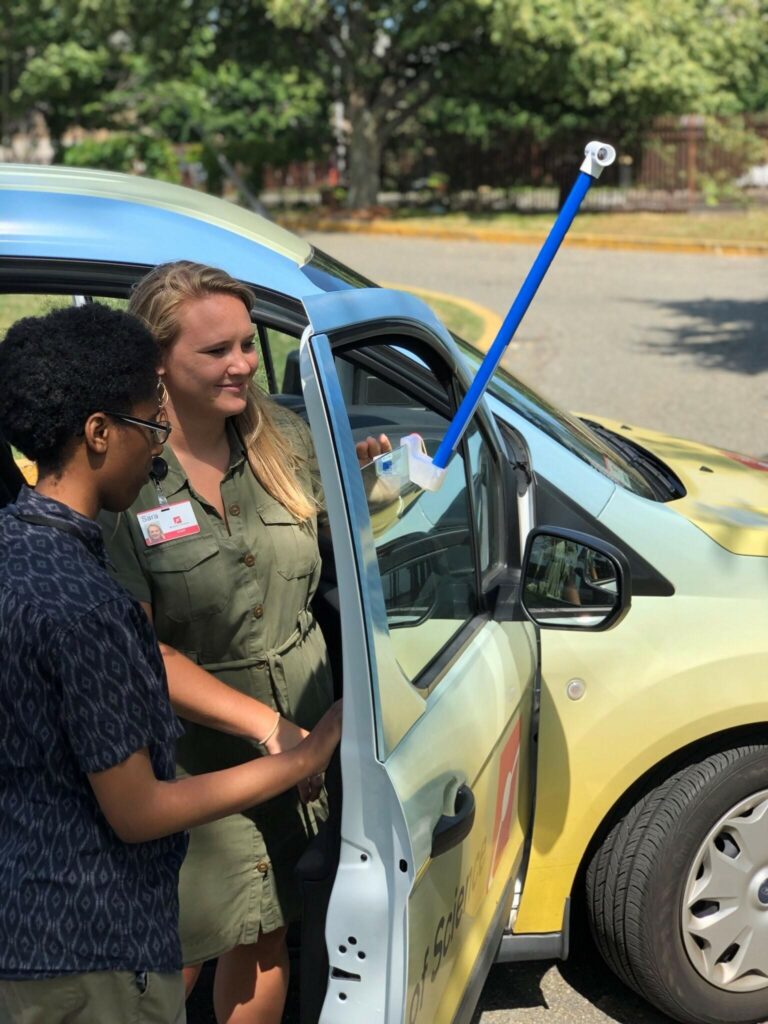
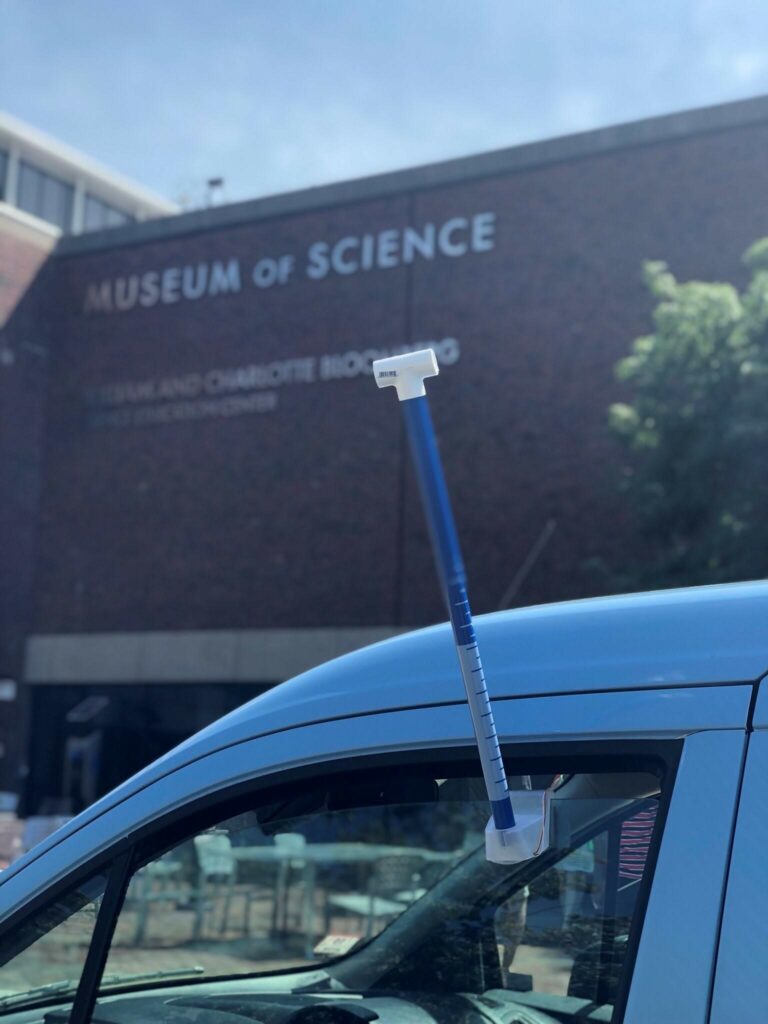
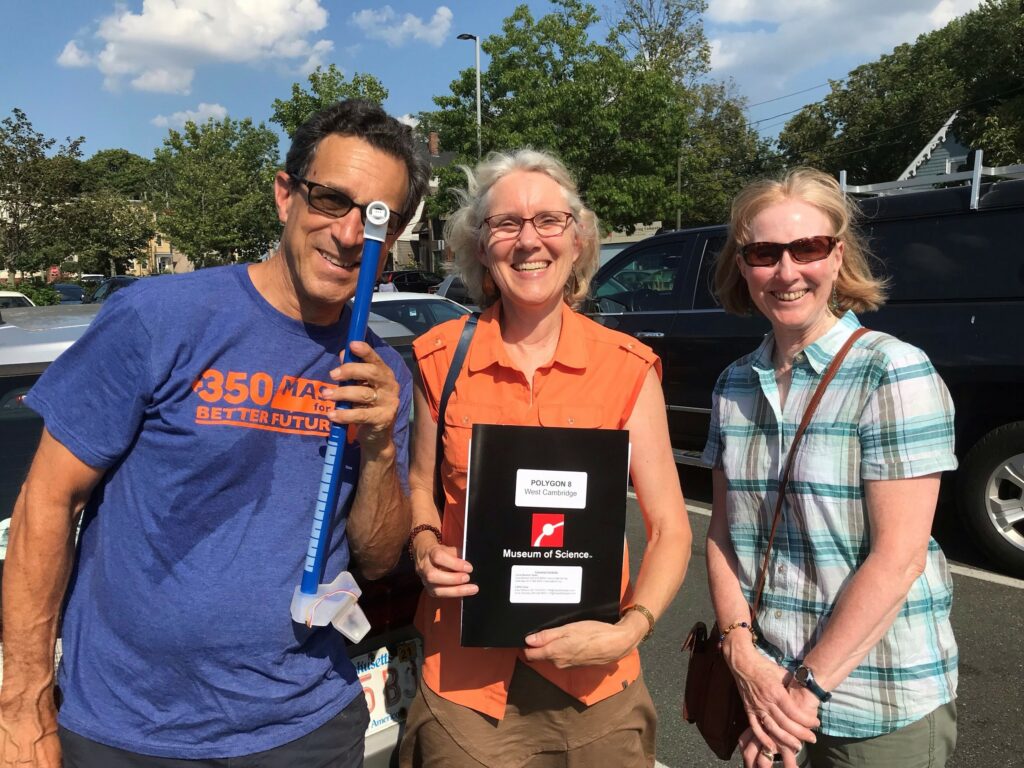
How can we help scientists collect this data? All it takes is a car, a sensor, and a few citizen scientists! This summer, the Museum of Science, Boston (MOS), and local citizen scientists used sensors to collect data for an ambient air temperature map of Boston, Cambridge, and Brookline, MA. This method was developed by CAPA Strategies, Portland State University, and the Science Museum of Virginia.
“Citizen science is a framework to change the power dynamics in research and educational systems. Science is everywhere, and experts are everywhere,” Pegan said.
MOS worked with city planners in Boston, Cambridge, and Brookline to divide the three cities into ten mapping routes. Citizen science teams were made up of at least one driver and one navigator, who drove together during hour-long mapping periods. The 3-D printed car mount and heat-sensing equipment (supplied by CAPA Heat Watch) allowed citizen scientists to attach a sensor device to their car and record the temperature and geospatial data of the surrounding areas.
As you might expect, not every day is a great extreme heat mapping day. For the drive to be successful, the expected high temperature had to be over 90 degrees Fahrenheit and clear skies. The perfect day came on July 29, when citizen scientist teams drove their assigned routes three times throughout the day: once at 6 AM, 3 PM, and 7 PM. These three time-stamped maps will show city planners where heat fluctuates in certain parts of the city throughout the day.
Solutions from and for the public
Bolduc said this type of citizen science is valuable because it engages the public and helps them understand heat related problems and solutions. “This is an issue with heat vulnerability, which is less obvious or tangible to the public compared to an issue like flooding,” he said.
By comparing heat maps with maps of various population demographics (like the young, the elderly, or those of low socio-economic status), city planners and researchers can find out which groups are most affected by the urban heat island effect.
Alison Field-Juma, a citizen scientist who helped with this project, said, “In the summer, I experience a dramatic change in temperature when I’m walking, biking, or driving, or whenever I am in the shade of a tree. I’m very glad that this on-the-ground data will be used in guiding investments and planning to keep our cities bearable.”
Kara Brewton, the Economic Development Director for the Town of Brookline, said it is important to involve a new and diverse group of people during the data collection process, because it brings more people into the conversation about how climate change is affecting different populations.
The project team hopes that by having a variety of communities work together to create various maps, there will be a broad spectrum of engagement across the Greater Boston area.
“Cambridge is excited to be working with the Museum of Science and our neighbors in Boston and Brookline. No city can be an island of resilience, so the more we work together on climate change and develop responses that can be spread across to other communities, the better off we will all be,” Bolduc said.
“We can’t count on corporations to provide the data we need”
On July 29, MOS’s first heat mapping campaign day kicked off with close to 50 citizen scientists who mapped Boston, Brookline, and Cambridge. Steven E. Miller, a citizen scientist who mapped Cambridge, said, “We can’t count on corporations to provide the data we need to create a sustainable and democratic society. It requires the efforts of citizens, as volunteer scientists and community activists, to make sure that we understand what’s actually happening with our environment and that appropriate public policies and programs are implemented.”
Are you ready to become a citizen scientist and help us create urban heat island maps for Boston, Cambridge, or Brookline? If you or someone you know is interested in helping the museum by collecting data this summer, click here to sign up.
Don’t live in the Boston area? The heat mapping campaign is also in seven other cities throughout the country, supported by the NOAA Climate Program Office. If your city is on the list, reach out to the local organizer to participate. For those who want to contribute but are unable to join in urban heat island mapping, there is another option! MOS is also collaborating with ISeeChange to collect data about urban heat. Head over to SciStarter to sign up and start posting about how urban heat is affecting you, and learn more about how climate hazards are impacting people around the world.
This project is possible thanks to the support of a NOAA Environmental Literacy grant. This blog post is part two of the “Wicked Hot Boston” Series. Did you miss part one? You can read it here.
Want more citizen science? Check out SciStarter’s Project Finder! With citizen science projects spanning every field of research, task and age group, there’s something for everyone!
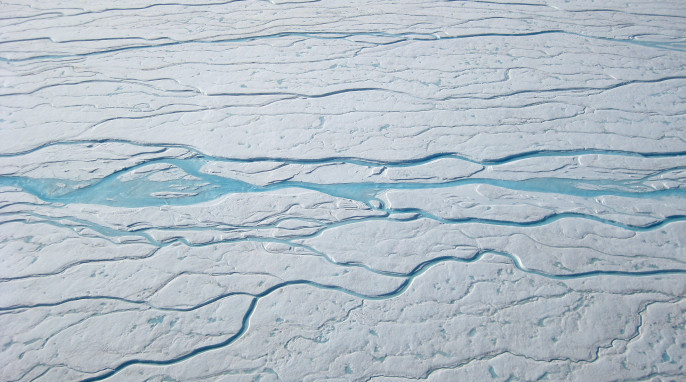
Featured Image: Chicago at Sunrise, photo by Max Goldberg, used with his permission.
As Forum Education Associate II at the Museum of Science, Boston, Emily Hostetler creates and oversees a variety of forum projects throughout the year. She premiered the pilot forums on climate intervention research in Boston and Phoenix last summer, and was a member of the team that built the nationally-implemented NOAA funded forums on extreme weather hazards. She is currently working with multiple local institutions to develop community-based forums to discuss substance use disorder and affordable housing in the Greater-Boston Area. Before joining the museum, Emily received her BA from Ohio Wesleyan University where she studied Biology and Journalism.
Sara Benson is a Forum Education Associate in the Forum Department at the Museum of Science, Boston. Sara is mainly focused on the Citizen Science, Civics, and Resilient Communities project and is passionate about resiliency strategies on climate hazards. Sara has her MA in Marine Affairs from University of Rhode Island and her BS in Marine Biology from University of North Carolina Wilmington.

Roxanne Lee is an intern in the Forum Department at the Museum of Science, Boston. Roxanne has a BS in Environmental Science from Simmons University and is currently pursuing a Master’s degree in Environmental Science and Policy at Northeastern University.